Chart list:
The list of charts you have in the image. With this behavior you can have an image with more charts toghether. Each one with its properties. When you click on one chart in the list the fields belowe display the properties of the selected chart.
Chart type:
The type of chart.
Available chart type:
- Smooth Line Chart
- Line Chart
- Column Chart
- Area Chart
- Stacked Column Chart
- Stacked Area Chart
- Pie Chart
Legend text:
The text displayed in the legend
Recordset:
The recordset where get the chart value. For each record will be create a chart point
Label field:
The label of the chart point. When you put more than one chart in the image the label will be the label of the first chart.
Value field:
The recordset field where get the value of the chart point. The recordset field must return a numeric value. When you put more than one chart in the same image remenber that all the chart must have the same number of point value so if you use different recordset the recordset must return the same number of records.
Max col width:
When you create a column chart this value is the max width of each chart's column
Fill color list:
This has different value for each chart type.
- Column and Area chart: you can define one or two colors and will be the colours of the column. If you define a gradient and 2 colour the column will be colored with a gradient color from the first color to the second colour.
- Pie chart: in this case you don't have limit in the number of colour. When the extension render the pie get a different color for each pie. If the number of pie exceed the number of colour the extension restart from the first colour.
- Line chart: Not available in this case
Shadow:
If checked add the shadow to the chart column, line
Shadow color:
The color of the shadow
Shadow offset:
The offset in pixel of the shadow for the X and Y axis
Line type:
The type of the line. The choose can be: Solid, Dash, DashDot, DashDotDot, Dot
Line color:
The colour of the line
Data label:
If checked display a label in the top of the chart poit with the point value.
Like this example:

Data label show title:
If checked display the title for the data label.
Like this example:

Data label color:
The colour of the data label text
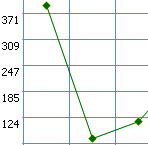
Marker type:
The type of the marker line for the line chart. The choose can be: circle, diamond, square, Triangle.
Like this example:

Marker size:
The size of the line marker
Marker color:
The color of the line marker
Marker border color:
The border color of the line marker
Marker image:
With this option you can define an image to use like line marker.
Like this example:

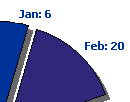
Pie chart explosion:
With this option you can define the pie chart explosion in pixel

